Unit 5-Linear Relations
This unit is about graphing skills, tables of values, linear equations, graphs and equations, graph analysis and interpolation and extrapolation.
Tables of Values
- A table of values allows you to either find the linear equation or plot points based on an equation on a graph.

Example-

Example- What is the table of values for 3x+2? Answer-
Procedure- I went 3 x 1 + 2, and that is 5. Once I figured it out, I went to the next one. 3 x 2 + 2 is 8. Then I knew that the pattern in the y column was adding 3 each time, so I did that for the rest of the numbers.
Procedure- I went 3 x 1 + 2, and that is 5. Once I figured it out, I went to the next one. 3 x 2 + 2 is 8. Then I knew that the pattern in the y column was adding 3 each time, so I did that for the rest of the numbers.
Equations
The parts of an equation are coefficient, constant term and variables.
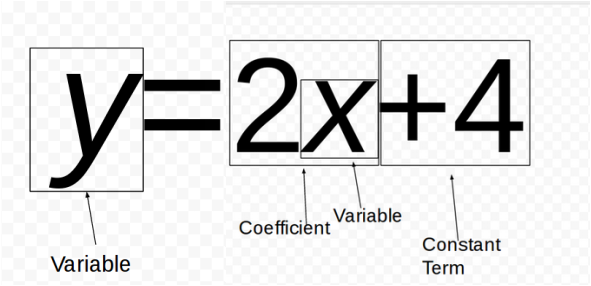
Because you follow BEDMAS, (Of course.), you have to multiply before you add. So, if X = 4, y = 12.
2 x 4 = 8 8 + 4 =12. When X = 4, Y = 12
Slope- Slope is rise over run, and it is calculated like this: Count how many spaces there are between the two points vertically. Divide this by how many spaces there are between the points horizontally.
2 x 4 = 8 8 + 4 =12. When X = 4, Y = 12
Slope- Slope is rise over run, and it is calculated like this: Count how many spaces there are between the two points vertically. Divide this by how many spaces there are between the points horizontally.


Try this problem.
Here is a link to some virtual graph paper. Try to plot the points on the graph before you look at the answer.
I used Roman numerals instead of normal numbers. When you think you have solved the problem, reveal the answer below.
